HOME / ESG / Green Environment
Green Environment
Climate Risk Management
Following the framework recommended by the TCFD, the Company has established a process for identifying, assessing and managing climate-related risks and opportunities, integrated with its existing enterprise risk management mechanism. The process comprises the following four stages:
1. Issue collection
Drawing on international climate trend reports, domestic and international climate policy and regulatory developments, industry research, and the topics of concern to stakeholders, the Company collects climate-related risks and opportunities with potential relevance to its operations.
2. Identification of risks and opportunities
Based on the issues collected, the project execution team combines input from all departments to identify the climate risks and opportunities most relevant to the Company’s operations. In 2025 the Company identified 11 climate-related risks and 8 climate-related opportunities, spanning regulation and policy, energy and resource use, supply chain stability, changes in customer behaviour, the low-carbon transition and brand reputation.
3. Assessment of risks and opportunities
For the climate risks and opportunities identified, the Company further assesses their likelihood of occurrence and degree of impact, and analyses their potential effects on operations, the supply chain and financial performance over the short term (1–2 years), medium term (2–5 years) and long term (more than 5 years).
4. Prioritisation and management
Items are prioritised using a risk matrix, and the climate risks and opportunities identified as priorities are incorporated into operating strategy and continuously tracked and adjusted, strengthening the Company’s resilience in adapting to climate risk.
- 01Issue collection
- 02Risk & opportunity identification
- 03Risk & opportunity assessment
- 04Prioritisation & management
Climate risk matrix
- Transition risk
-
- 1Stronger climate-related financial disclosure obligations
- 2Introduction of domestic and international carbon taxes and carbon fees
- 3Tightening emission and energy-efficiency standards requiring a set proportion of green electricity
- 4Financial institutions incorporating carbon emission risk into lending assessments
- 5Price increases driven by the low-carbon transition, carbon taxes or supply chain tightening
- 6Changing customer behaviour and rising demand for low-carbon products and sustainable practices
- 7Failure to meet stakeholder expectations on sustainability performance
- 8Higher equipment energy consumption and rising maintenance costs
- Physical risk
-
- 9Extreme weather disrupting the supply chain
- 10Natural disasters increasing the frequency of work stoppages and voltage dips
- 11Rising sea levels and the risk of asset damage at operating sites
Key climate risk response measures
To respond effectively to the risks and opportunities above, the Company has formulated corresponding strategies with reference to the likelihood, severity of impact and financial consequences of each issue, providing an important basis for risk governance and sustainability decisions.
| Type | Risk topic | Risk description | Financial impact | Measures adopted |
|---|---|---|---|---|
| Market risk | Changing customer behaviour and rising demand for low-carbon products and sustainable practices. | 1. As customers shift toward low-carbon products, the Company must invest in R&D and adopt new technologies, increasing development costs. 2. Sustainability questionnaires such as CDP and SAQ must be completed; failing to meet the required standards could result in lost orders. |
1. Higher R&D costs and capital expenditure 2. Failure to meet customer expectations could affect revenue and gross margin |
1. Set and track targets under the emission reduction action plan. 2. Set corresponding target policies for each dimension of customer requirements so that they can be met. |
| Physical risk | Natural disasters increasing the frequency of work stoppages and voltage dips. | 1. The rising intensity and frequency of natural disasters prevents employees from getting to work, causing stoppages or delivery delays. 2. Typhoons cause voltage dips that disrupt production. 3. Frequent earthquakes damage buildings and equipment, interrupting capacity and creating personnel safety risks, and further increasing repair and management costs. |
Higher operating costs | 1. Plan on-duty personnel and essential equipment safety measures in advance. 2. Complete critical production scheduling before a typhoon arrives. 3. Establish an emergency contact system so that conditions can be reported immediately after an earthquake. |
| Market risk | Tightening emission and energy-efficiency standards. | Government and customer requirements for a set proportion of green electricity raise the Company’s energy costs. Without advance planning of power purchase agreements or the installation of renewable energy, the Company could face compliance risk and even be excluded from supply chain partner lists. | Higher operating and electricity purchase costs | Continue to work with JET Energy within the group to evaluate long-term power purchase agreements or self-built renewable energy options, ensuring compliance and stable power costs. |
Metrics and targets
To manage climate risk effectively and drive decarbonisation, the Company continues to establish climate-related management metrics and to set specific targets for tracking performance. For 2025 the Company set the following key targets:
- An absolute reduction of 1% in the Company’s total Scope 1 and Scope 2 greenhouse gas emissions.
- A 2% reduction in greenhouse gas emission intensity against the base year for JET Optoelectronics, and a 5% reduction for the Kaohsiung branch and JET Opto (Suzhou) Co., Ltd..
Going forward, the Company will continue to strengthen its greenhouse gas inventory management mechanism and progressively evaluate the adoption of science-based targets (SBTi) and an internal carbon management mechanism, in order to improve the effectiveness and transparency of its decarbonisation strategy.
Greenhouse Gas Emissions
Faced with the challenge of global climate change, companies must continuously reduce the greenhouse gas emissions generated by their operations in order to mitigate their negative effect on the climate. If greenhouse gas emissions continue to rise year after year, the Company could face regulatory, reputational and market risks, including higher carbon fee (tax) costs, an inability to meet customer (market) requirements, and failure to meet its publicly announced carbon reduction targets. As a full-service technology provider in automotive electronics, delivering product development and services to customers worldwide, our capability in low-carbon manufacturing and green product services directly affects our market competitiveness. Accordingly, from 2024 onwards the Company has completed a voluntary Scope 1 and Scope 2 greenhouse gas inventory for its Taipei headquarters, Kaohsiung branch and the JET Opto (Suzhou) subsidiary in accordance with the ISO 14064-1 standard, and has formulated short-, medium- and long-term carbon reduction plans in response to the expectations of its wide range of stakeholders.

JET Optoelectronics — greenhouse gas emissions, last three years
| Quantitative indicator | Unit | 2023 | 2024 | 2025 |
|---|---|---|---|---|
| Scope 1: direct greenhouse gas emissions | tonnes CO₂e | 35.51 | 35.30 | 38.66 |
| Scope 2: indirect greenhouse gas emissions | tonnes CO₂e | 303.88 | 292.28 | 317.78 |
| Total emissions = Scope 1 + Scope 2 | tonnes CO₂e | 339.39 | 327.58 | 356.44 |
| Organisation-specific metric | Average number of employees for the year (persons) | 169 | 174 | 170 |
| Greenhouse gas emission intensity | tonnes CO₂e / average employees for the year (persons) | 2.01 | 1.88 | 2.10 |
Kaohsiung branch — greenhouse gas emissions, last three years
| Quantitative indicator | Unit | 2023 | 2024 | 2025 |
|---|---|---|---|---|
| Scope 1: direct greenhouse gas emissions | tonnes CO₂e | 475.22 | 132.80 | 134.00 |
| Scope 2: indirect greenhouse gas emissions | tonnes CO₂e | 1,710.46 | 1,807.10 | 1,750.55 |
| Total emissions = Scope 1 + Scope 2 | tonnes CO₂e | 2,185.68 | 1,939.90 | 1,884.56 |
| Organisation-specific metric | Annual production put into stock (KPCS) | 63.00 | 516.30 | 1,418.34 |
| Greenhouse gas emission intensity | tonnes CO₂e / annual production put into stock (KPCS) | 34.69 | 3.76 | 1.33 |
JET Opto (Suzhou) Co., Ltd. — greenhouse gas emissions, last three years
| Quantitative indicator | Unit | 2023 | 2024 | 2025 |
|---|---|---|---|---|
| Scope 1: direct greenhouse gas emissions | tonnes CO₂e | 87.69 | 59.59 | 48.11 |
| Scope 2: indirect greenhouse gas emissions | tonnes CO₂e | 1,083.95 | 1,037.58 | 963.48 |
| Total emissions = Scope 1 + Scope 2 | tonnes CO₂e | 1,171.64 | 1,097.18 | 1,011.59 |
| Organisation-specific metric | Annual production put into stock (KPCS) | 443.46 | 268.02 | 364.06 |
| Greenhouse gas emission intensity | tonnes CO₂e / annual production put into stock (KPCS) | 2.64 | 4.09 | 2.78 |
Notes on the calculation:
1. The Company’s energy indirect emissions (Scope 2) are estimated from the electricity bills of each site to derive purchased electricity emissions. The Taiwan emission factor is based on the 2024 electricity emission factor announced by the Energy Administration, Ministry of Economic Affairs; the China emission factor uses the 2023 average emission factor for the East China grid.
2. The GWP values used for greenhouse gas emissions in this report are those published in the 2021 IPCC Sixth Assessment Report.
3. The calculation method follows ISO 14064:2018; third-party verification is scheduled for 2027.
Energy Management
The Company’s principal energy types are electricity, gasoline and diesel, all of which are non-renewable; renewable energy is not yet used within the organisation. Going forward, the Company will continue to strengthen its energy management measures and evaluate the feasibility of introducing renewable energy, so as to progressively improve the resilience of its energy mix and advance energy saving and carbon reduction.
JET Optoelectronics — energy consumption, last three years
| Quantitative indicator | Unit | 2023 | 2024 | 2025 |
|---|---|---|---|---|
| Electricity consumption | kWh / year | 613,907.00 | 616,627.00 | 641,205.24 |
| GJ | 2,210.06 | 2,219.85 | 2,308.34 | |
| Gasoline consumption | L / year | 3,549.00 | 3,564.23 | 3,208.72 |
| GJ | 115.90 | 116.40 | 104.79 | |
| Diesel consumption | L / year | 637.82 | 420.84 | 362.82 |
| GJ | 22.43 | 14.80 | 12.76 | |
| Total energy consumption | GJ | 2,348.40 | 2,351.06 | 2,425.89 |
| Organisation-specific metric | Average number of employees for the year (persons) | 169 | 174 | 170 |
| Energy intensity | GJ / person | 13.90 | 13.51 | 14.27 |
Kaohsiung branch — energy consumption, last three years
| Quantitative indicator | Unit | 2023 | 2024 | 2025 |
|---|---|---|---|---|
| Electricity consumption | kWh / year | 3,455,469.30 | 3,812,449.43 | 3,693,153.63 |
| GJ | 12,439.69 | 13,724.82 | 13,295.35 | |
| Gasoline consumption | L / year | 1,301.88 | 1,791.11 | 1,272.34 |
| GJ | 42.52 | 58.49 | 41.55 | |
| Total energy consumption | GJ | 12,482.21 | 13,783.31 | 13,336.90 |
| Organisation-specific metric | Annual production put into stock (KPCS) | 63.00 | 516.30 | 1,418.34 |
| Energy intensity | GJ / KPCS | 198.14 | 26.70 | 9.40 |
JET Opto (Suzhou) Co., Ltd. — energy consumption, last three years
| Quantitative indicator | Unit | 2023 | 2024 | 2025 |
|---|---|---|---|---|
| Electricity consumption | kWh / year | 1,867,709.00 | 1,819,350.00 | 1,751,780.00 |
| GJ | 6,723.75 | 6,549.66 | 6,306.41 | |
| Gasoline consumption | L / year | 4,084.10 | 3,871.92 | 4,124.31 |
| GJ | 133.37 | 126.46 | 134.69 | |
| Total energy consumption | GJ | 6,857.13 | 6,676.11 | 6,441.10 |
| Organisation-specific metric | Annual production put into stock (KPCS) | 443.46 | 268.02 | 364.06 |
| Energy intensity | GJ / KPCS | 15.46 | 24.91 | 17.69 |
Notes on the calculation:
1. Conversion factors are taken from the greenhouse gas emission factors announced by the Environmental Protection Administration on 5 February 2024.
2. The electricity calorific conversion used is 1 kWh = 0.0036 GJ.
3. Electricity consumption figures are taken from Taipower electricity bills and electricity tax invoices.
Renewable Energy Investment
In response to the national energy transition policy and in fulfilment of its corporate social responsibility, the Company actively promotes the construction of renewable energy facilities, supporting the realisation of a low-carbon society through concrete action and demonstrating its long-term commitment to energy sustainability and environmental protection.
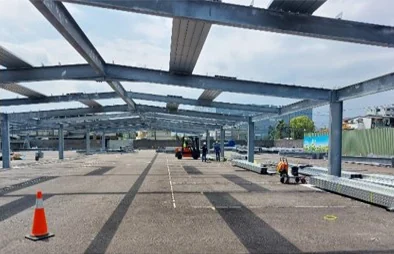
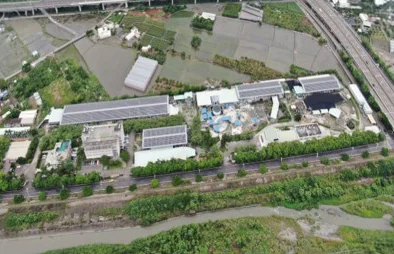
As of 2025 the Company had completed and brought into operation two solar photovoltaic sites with a combined installed capacity of 2,205.31 kW. The ground-mounted solar site in Wujie, Yilan has an installed capacity of 1,152.51 kW and was completed and connected to the grid in 2025; the rooftop solar site in Wufeng, Taichung has an installed capacity of 1,052.8 kW and has generated power steadily since 2020.
Looking ahead, JET Optoelectronics will continue to evaluate the feasibility of installing renewable energy at other sites, and plans to introduce self-generated, self-consumed green electricity at its plants in order to raise the proportion of green power used, reduce reliance on conventional energy and lower carbon emission risk.